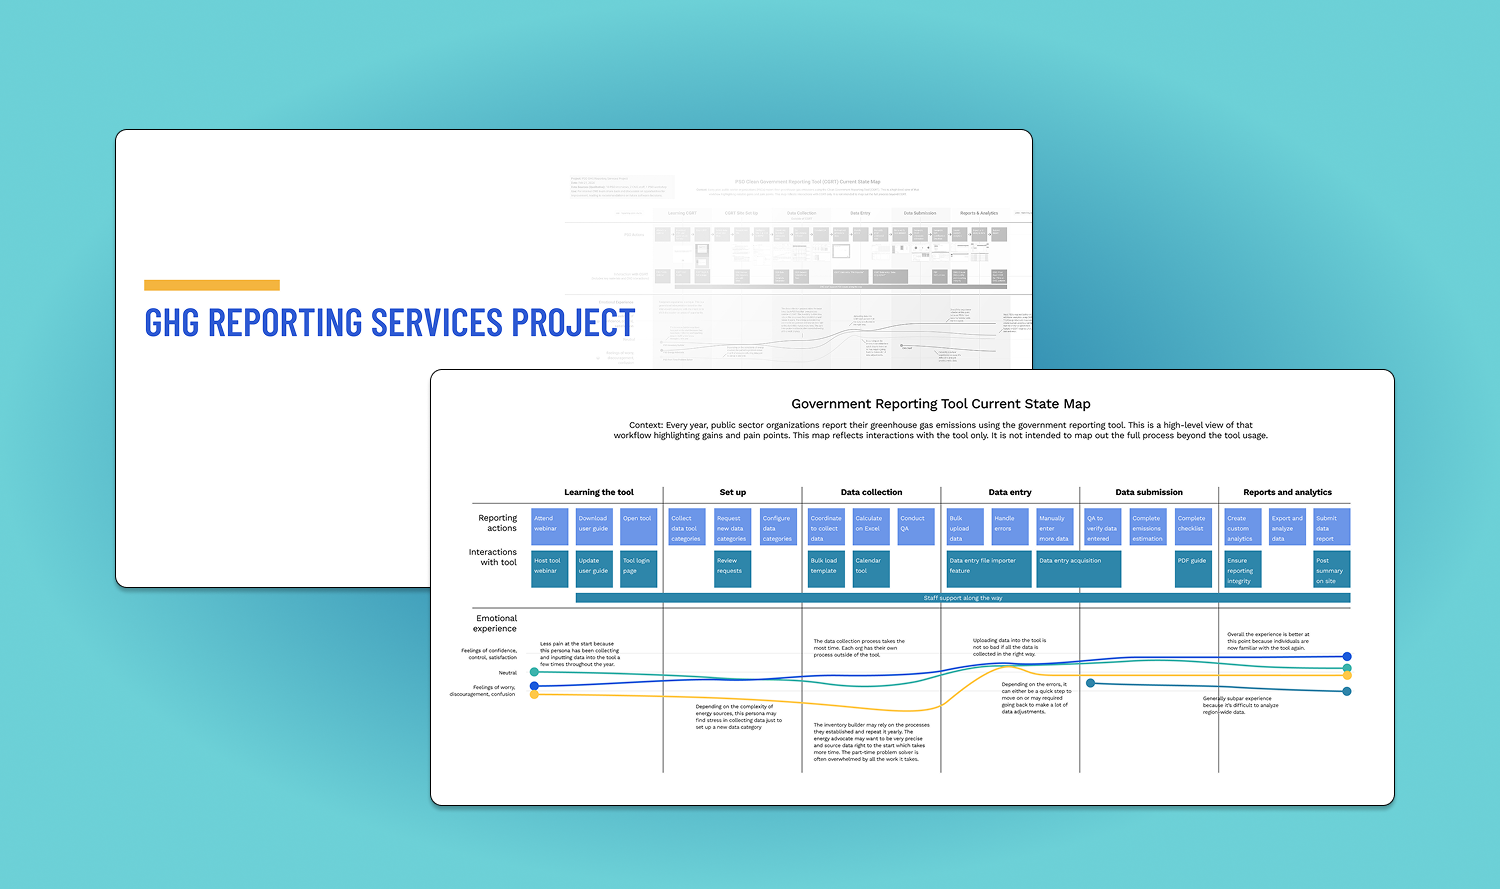
Provided service design for the public sector by analyzing a government emissions reporting tool, equipping decision-makers with actionable insights on its 1–3 year direction. (2024)
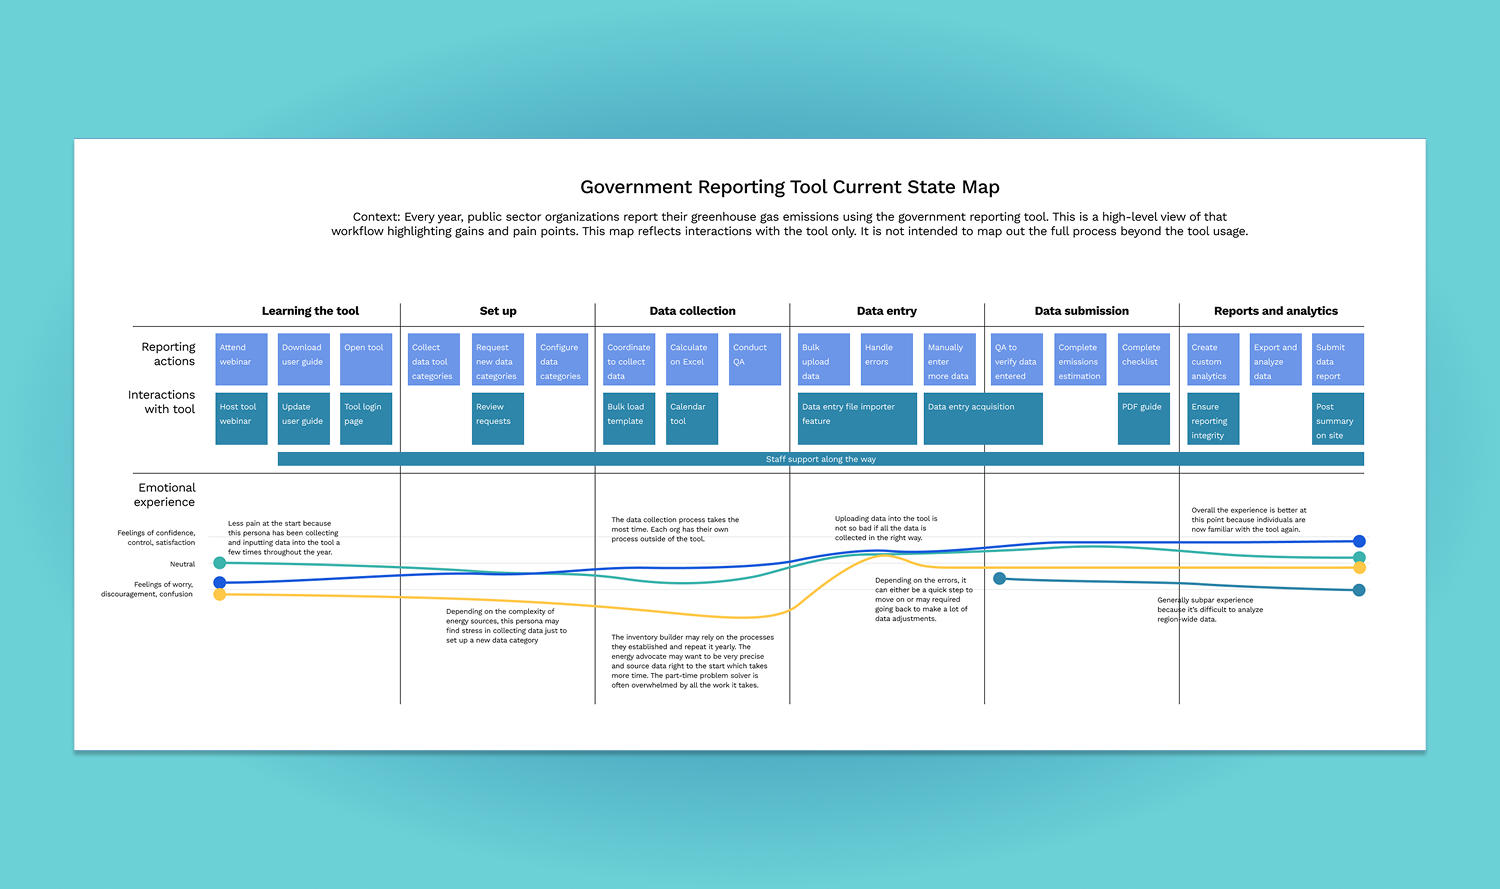
As a long-term effort to achieve carbon neutrality, a Canadian provincial government had mandated that public sector organizations report their yearly greenhouse gas (GHG) emissions so that these could be offset. At the ground level, the practice of tracking emissions was difficult for many organizations, especially those that lacked dedicated staff and resources for this kind of detailed and technical reporting. The tool required highly granular and frequent reporting. There were also challenges on the government side, due to limitations in the tool's analysis capabilities for calculating final offsets and producing higher-level reports. That's when I joined the team.
I was contracted as a service design consultant for a 3-month project to conduct research and deliver structured recommendations on the major pain points to inform decisions about the tool. My goal was to map the end-to-end experience of public sector employees to surface where the process broke down.
The project was divided into three phases.
In phase 1, I refined the project work plan and developed the research plan. I reviewed the existing tool and summarized some background research including past surveys.
In phase 2, I led the recruitment of 16 participants for online interviews and 10 for an online workshop to learn more about the process, issues, and workarounds associated with emissions reporting. Through a shared spreadsheet, the rest of the team could track progress. Some also joined interview sessions as observers.
In phase 3, I synthesized the data and created a report and journey map/service blueprint (a visual map of the end-to-end reporting experience). As a final hand-off, I led an executive presentation to share the findings.
It was often a single person who carried the burden of reporting even though it was not their official job role. Few organizations had dedicated staff to manage reporting. Having a way to recognize their efforts could provide a stronger incentive for data reporting. The emissions tool should also automate as much of the process as possible.
Because greenhouse gas reporting only happens once a year, it was easy to forget how the software worked. Having to relearn the same steps every year felt frustrating. Having access to updated manuals and human support was key to helping users get back up to speed.
Even though the emissions reporting tool wasn't the most intuitive to use, some organizations had developed interesting workarounds to get the job done. For example, one organization had built their own tracking spreadsheets that could be converted more easily into the format the system required. The team could push their vendor to eliminate the need for these workarounds.
I presented a range of insights and recommendations to the executive team. The most important outcome was that team members heard directly how people felt about the tool. Some recommendations informed feature prioritization; others shaped strategic decisions about what projects to invest in and whether to continue with the same vendor or change to a tool that better addresses major reporting challenges.
Through this project I learned that service design in government (at least in the context I was working in) was quite structured and followed a well-defined methodology. Having worked in service design for many years, I was familiar with the process and pleasantly surprised by how committed the team members were to user experience. The main challenge was that the service designer's contract remained focused on research outputs, with findings then passed through bureaucratic processes. I would love to see service design contract work also include implementation. This would help ensure that what users told us in interviews actually shapes how the tool evolves.